Causal Inference
BIG DATA I REAL WORLD DATA EN L'ANÀLISI DE LA UTILIZACIÓ, SEGURETAT I EFECTIVITAT DE MEDICAMENTS, TECNOLOGIES I INTERVENCIONS SANITÀRIES
The main speech of a next workshop is about causal inference by Miguel Hernan. If you want to have a look at his book, you'll find it here.
Causal inference is one of the main issues that current machine learning methodologies often try to skip. Finally we do need to know the factors, the causes that produce a consequence, a disease. And for example with risk adjustment, it happens the same. The methodology has to provide a clear understanding of the factors for adjustment and weights. Otherwise it would be a blackbox.
05 de juliol 2019
04 de juliol 2019
On sufficiency
What Is Enough? Sufficiency, Justice, and Health
The capability approach is an alternative to welfarist and extra-welfarist approaches to health economic evaluations. Unfortunately, it is not so easy to put into practice. The chapter 15 of a book sheds some light on the issue.

The capability approach is an alternative to welfarist and extra-welfarist approaches to health economic evaluations. Unfortunately, it is not so easy to put into practice. The chapter 15 of a book sheds some light on the issue.
The approach developed by us is based on an outcome called years of sufficient capability (YSC). Instead of focusing on the absolute gains of capability across a population (i.e., capability maximization), the YSC targets those who fall below a threshold level of sufficient capability, with the aim being to improve capability to sufficient levels for those who are “capability poorThese are the five capabilities of most importance:
Stability— “ability to feel settled and secure”However, at the end, the same question without easy answer:
Attachment— “an ability to have love, friendship, and support”
Autonomy— “an ability to be independent”
Achievement— “an ability to achieve and progress in life”
Enjoyment— “an ability to experience enjoyment and pleasure”
How to define a sufficient threshold of capability needs to be considered further. One approach would be to conduct qualitative research using participatory methods to assign a sufficient threshold for a given population.Unfortunately the proposal of participatory methods and the measurement of capabilities is illusory, at least in my view.
02 de juliol 2019
Episode groupers: a crucial tool for population health management
A practical guide to episode groupers for cost-of-illness analysis in health services research
Summary of analytic components in selected episode groupers.
| Product | Episode example | Sample conceptual focusa | Number of episodes | Clinical setting | Public episode definition | Linked risk-adjustment approach |
|---|---|---|---|---|---|---|
| 3M Patient-focused Episode Software | Not reported. | • Event-based episodes per patient • Cohort-based episodes among patients with a shared condition or characteristic | >500 | All | No | 3M Clinical Risk Groups |
| Cave Grouper | Urinary tract infection | • Physician relative efficiency and effectiveness scores • High-cost patient prediction | >500 | All | No | CCGroup MediScreen |
| CMS-BPCI | Urinary tract infection | Inpatient and post-acute care | ~50 | Inpatient, skilled nursing facility, inpatient rehabilitation facility, long-term care hospital or home health agency | Yes | No |
| McKinsey & Company | Perinatal | Principal Accountable Provider | >100 | All | Yes | Yesb |
| Optum Symmetry Episode Treatment Groups | Pregnancy, with delivery | • Patient total cost of care by condition categories • Provider profiling | >500 | All | Yes | Optum Symmetry Episode Risk Groups |
| OptumInsight Symmetry Procedure Episode Groups | Radical hysterectomy | • Medical and surgical procedure cost • Provider profiling | ~200 | All | No | Optum Symmetry Episode Risk Groups |
| Prometheus Analytics | Pregnancy | Potentially avoidable complications | ~100 | All | Yes | Prometheus Analytics risk adjustment |
| Medical Episode Grouper | Cardiac arrhythmias | • Population profiling • Provider profiling | >500 | All | No | Disease Staging and Diagnostic Cost Groups |
Information as of January 2019 in public documentation reviewed for this article, which comprised peer-reviewed articles and Internet searches for vendor product names; sources as cited in the References list. Readers are encouraged to check those and related sources for more details and updated information on the groupers briefly summarized here.
CMS-BPCI Centers for Medicaid and Medicare Services’ Bundled Payments for Care Improvement.
aAs highlighted in public documentation primarily from vendors; this is not an exhaustive list of conceptual orientations among profiled groupers.
bNot detailed in public documentation reviewed for this article in cited sources.
25 de juny 2019
Behavioral insights
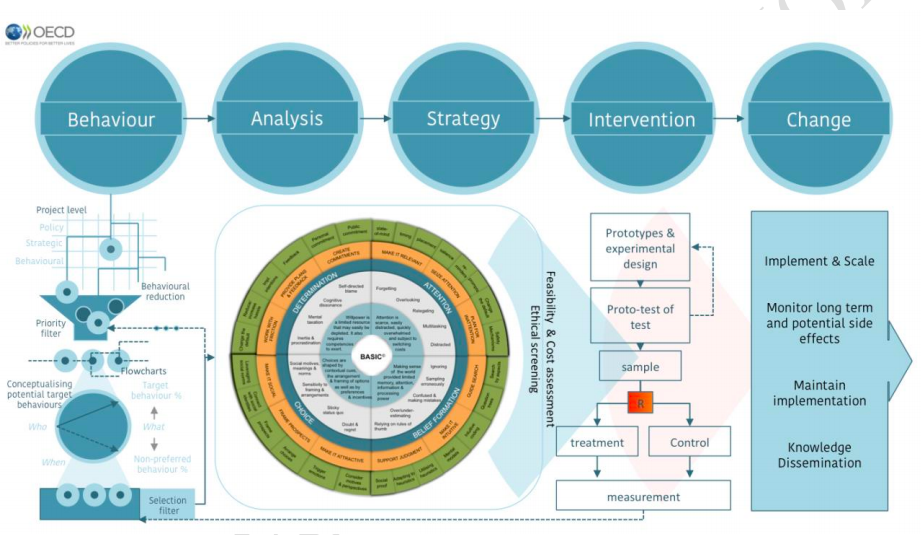
BEHAVIORAL INSIGHTS. BASIC TOOLKIT AND ETHICAL GUIDELINES FOR POLICY MAKERS
This OECD report is really helpful. It tries to provide a concret approach to behavioral insights for policy makers. It goes beyond standard nudging perspective.
This OECD report is really helpful. It tries to provide a concret approach to behavioral insights for policy makers. It goes beyond standard nudging perspective.
24 de juny 2019
Making healthcare more human
Eric Topol on making healthcare more human
A weekly conversation that looks at the way technology is changing our economies, societies and daily lives. Hosted by John Thornhill, innovation editor at the Financial Times.
20 de juny 2019
Pharma outlook
World Preview 2019,Outlook to 2024
If worldwide Total Prescription Drug Sales (2010-2024) increase 6,9% every year between 2019 to 2024 than somebody has to tell me the source to achieve such resources. This is the estimate of a report. I know, the report says worldwide, but it seems an expected revenue that it is really out of any budget, public and private. We'll see.
If worldwide Total Prescription Drug Sales (2010-2024) increase 6,9% every year between 2019 to 2024 than somebody has to tell me the source to achieve such resources. This is the estimate of a report. I know, the report says worldwide, but it seems an expected revenue that it is really out of any budget, public and private. We'll see.
Prescription drug sales for 2010 through 2018 grew at a CAGR of +2.3%. This can be compared to the forecast annual CAGR of +6.9% for 2019 through 2024 with expected sales to reach $1.18trn. The growth rate for the prescription market in 2019 is forecast to be +2.0%, which depicts a decline in growth rate compared to 2018 (+5.0%). So far the industry has seen a major set-back with one of the biggest failures, aducanumab, which was discontinued in Phase 3 trials for Alzheimer’s disease.Distrust fortune tellers. Nobody knows anything about the future.
19 de juny 2019


18 de juny 2019
Resource allocation for universal coverage in healthcare
Price setting and price regulation in health care: Lessons for advancing Universal
Health Coverage
Once upon a time Joseph Newhouse said that there are no prices in healthcare. There are some forms of administered prices, tariffs and payment systems. Unfortunately current health economists forget to read some books like "Pricing the priceless", a must read.
Now a new report by WHO and OECD insists again on prices and says:
Pricing health services is a key component in purchasing the benefits package (the covered services) within the overall financing system (Evetovits, 2019). Pricing and payment methods are important instruments in purchasing that provide incentives for health care providers to deliver quality care. A second instrument is contracting, in which the conditions for the payment of services are defined, and prices can be used as signals to providers. A third is performance monitoring. Where health care providers are rewarded based on the outcomes they achieve, these payments also must be priced correctly to provide the right incentives.Right, there are more elements in the equation than prices, but the tools for fine tunning are too open. Anyway, this report is really welcome and the cases are well described.
15 de juny 2019
Who is in charge of Pharma R&D?
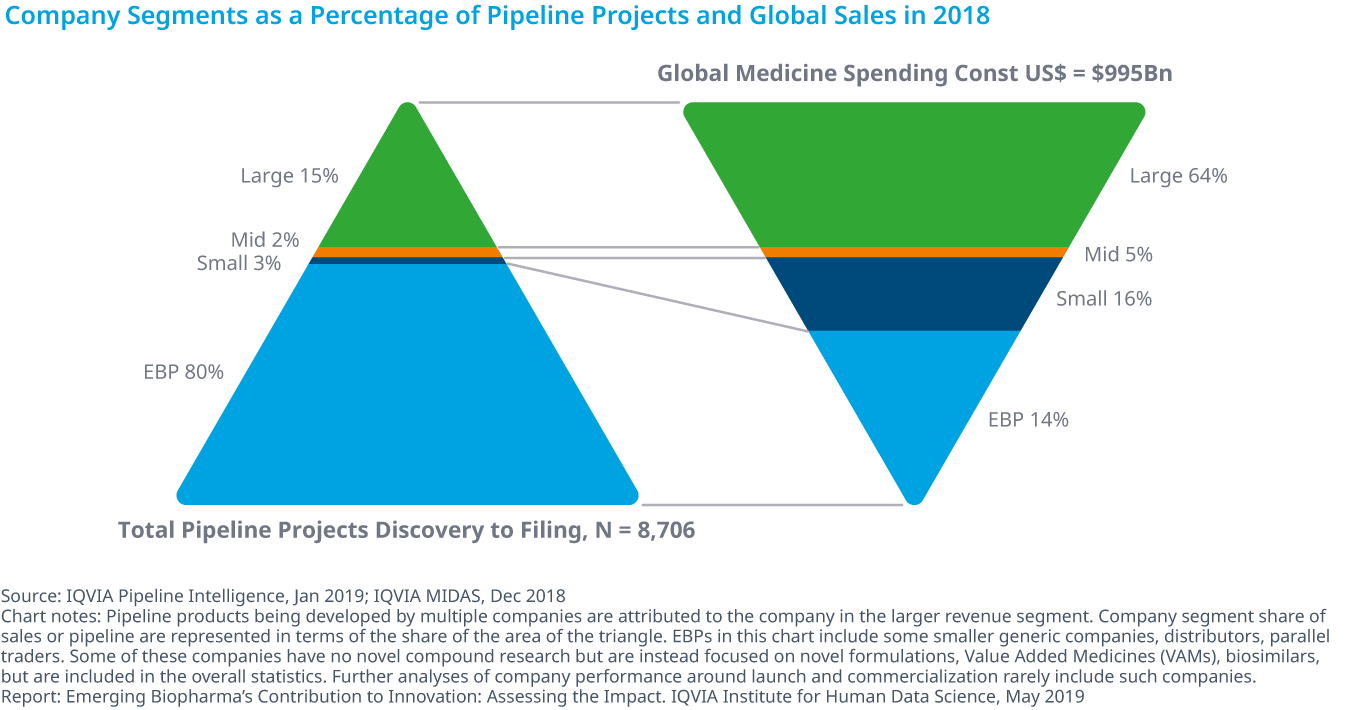
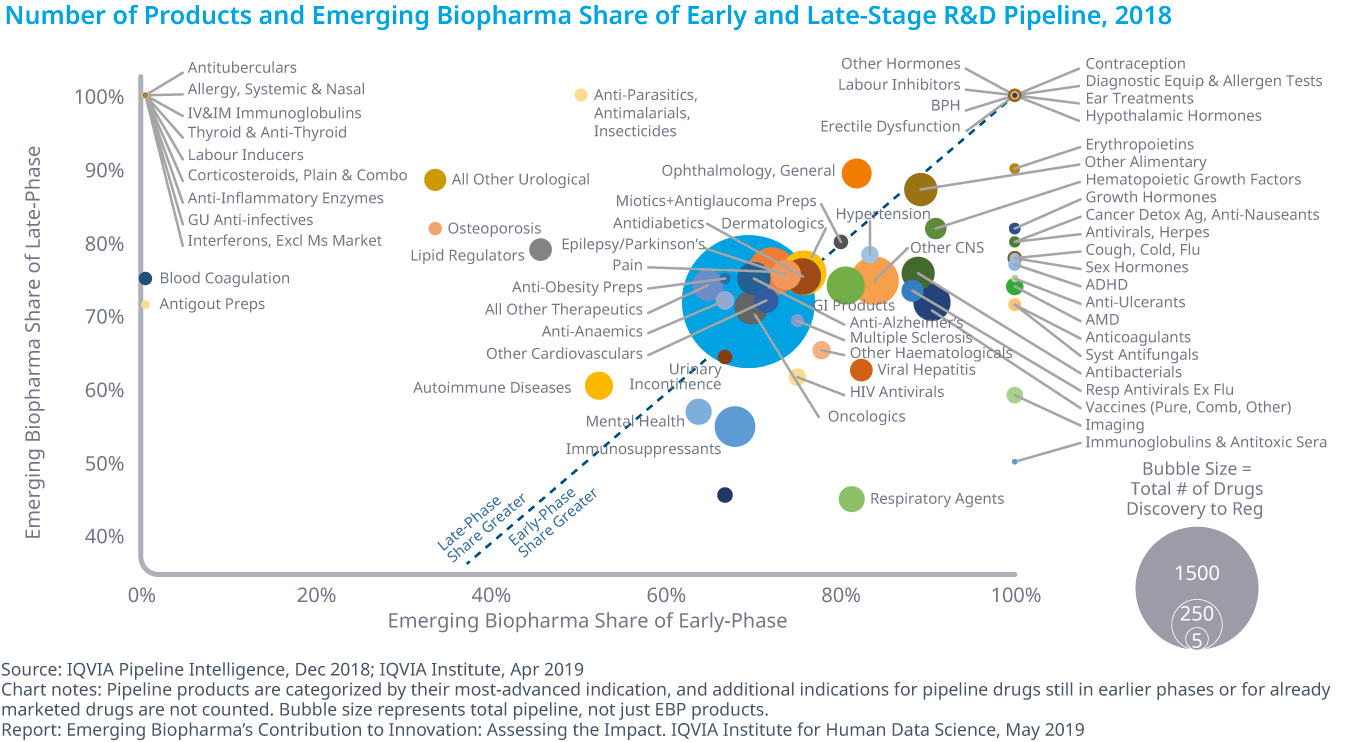
Emerging Biopharma’s Contribution to Innovation
From the report:
From the report:
- Emerging biopharma companies accounted for 73% of the total late-stage R&D pipeline in 2018, compared with 61% in 2008.
- Large pharma companies have seen their share drop from 27% to 19% from 2017 to 2018.
- The share of mid-sized and small pharma companies developing novel products has remained steady since 2003, with small pharma developing approximately 5–6% of products and mid-sized pharma developing from 2–5%.
- Emerging biopharma companies are increasing their pipeline share, because they are the most active in the fastest-growing areas of oncology and orphan drugs, and because they increasingly can develop their innovations without the need to partner or be acquired.
14 de juny 2019
The productivity and outcome of oncology pipeline
Global Oncology Trends 2019
IQVIA has released a report on current state of oncology treatments.
PS. Cancer drugs report 2018, Libro blanco terapia celular
IQVIA has released a report on current state of oncology treatments.
The 2018 launch of 15 new active substances (NASs) bring the total NAS launches since 2013 to 57 with 89 approved indications for 23 different tumor types Within the R&D oncologic pipeline, the most intense activity is for immunotherapies, with almost 450 in clinical development A total of 1,170 oncology clinical trials were initiated in 2018, an increase of 27 percent from 2017 and 68 percent from 2013 More than 700 companies across the globe have oncology drugs in late-stage development, including 626 emerging biopharma companies and 28 out of the 33 largest pharma companiesOn costs in USA:
The average annual cost of new medicines continues to trend upward, although the median cost dropped $13,000 in 2018 to $149,000, and cost per product ranged betweenOn value?
$90,000 and over $300,000. The mean cost for new brands in 2018 was $175,578, down from $209,406 in 2017, but was above the $143,574 mean from 2012 to 2018.
Spending on cancer medicines is heavily concentrated, with the top 38 drugs accounting for 80% of total spending. Over half of cancer drugs earn more than $143.6 million in annual sales and in aggregate account for only 2.2% of oncology spending.
PS. Cancer drugs report 2018, Libro blanco terapia celular
13 de juny 2019
Pharma R&D failure and success (2)
Estimation of clinical trial success rates and related parameters
The largest investigation thus far into clinical trial success rates and related parameters sheds light on the issue.

The largest investigation thus far into clinical trial success rates and related parameters sheds light on the issue.
We find that the overall success rate for all drug development programs did decrease between 2005 (11.2%) and 2013 (5.2%), as anecdotal reports suggest. However, this decline reversed after 2013. The overall success rate is mainly driven by changes in POS1,2 and POS2,3. The timing of the upward trend coincides with the time period during which the FDA has been approving more novel drugs,compared to the historical mean.Quite surprising. The accelerated approval by FDA ends with more drugs withdrawn from the market. Therefore, the probability of success is a flawed statistic. It should be adjusted according to regulator criteria.
12 de juny 2019
The changing burden of disease
EVOLUCIÓN DE CARGA DE ENFERMEDAD YCOSTES ASISTENCIALES DE UNA COHORTE POBLACIONAL DURANTE 7 AÑOS
Today we've made a presentation at the Health Economics Conference. The rethoric of increasing chronic conditions requires a precise estimates and cohort analysis is the way to proceed. This is what we have done and you can check the details in p.70 of the abstracts book.
Today we've made a presentation at the Health Economics Conference. The rethoric of increasing chronic conditions requires a precise estimates and cohort analysis is the way to proceed. This is what we have done and you can check the details in p.70 of the abstracts book.
07 de juny 2019
Long-term care funding mess
THE PUBLIC ECONOMICS OF LONG-TERM CARE. A SURVEY OF RECENT CONTRIBUTIONS
Everybody agree that long-term care funding is a complete mess. Ten years after enacting a law, access to services is constrained by funding restrictions and bad design of benefits. A lot of people wait for benefits until die and afterwards the family receive the approval for long-term care.
What should be done?. A recent article reviews the options.
LTC needs are increasing rapidly and neither the market nor the family seem to be able to meet such a mounting demand. Furthermore, the existing public programs are both insufficient and uncoordinated. For these reasons we advocate developing a full-fledge LTC public insurance scheme that would fulfill two objectives: assisting those who cannot count on any family assistance and do not have the financial means of purchasing LTC services and providing the middle class a program that would protect families against too costly spendingIs there enough public money to pay for this?
Obama by Kehinde Wiley
06 de juny 2019
Health microsystems as the unit of performance analysis
A comparative performance analysis of a renowned public-private partnership for health care provision in Spain between 2003 and 2015
A deep study has been released on performance of public-private partnerships in healthcare in Valencia compared to Spanish NHS. It is an:
PS. Opioid Epidemic CDC data

A deep study has been released on performance of public-private partnerships in healthcare in Valencia compared to Spanish NHS. It is an:
Observational study on secondary data from virtually all hospital care episodes produced in 51integrated providers (i.e., administrative healthcare areas) and 67 hospitals, in 2003 and 2015. Alzira’s2015 performance (and its variation since 2003) was compared with all public-tenured peers in the SNHS,using 26 indicators analysing the differences in age-sex standardized rates of events or risk-adjusted mortality, severity-adjusted hospital expenditure and hospital technical efficiencyAnd the conclusion is:
In this comprehensive comparative study on Alzira’s performance, this PPP has not generally outperformed public-tenured providers, although in some areas of care its developments have been outstanding.I agree on the methodology, I can't asses the results and its conclusions because it requires data replication. What it is crucial is the clinical decision making within the health organization (the microsystem and its episodes of care), forget generalizations on public and private and focus on drivers for efficiency in each setting.
PS. Opioid Epidemic CDC data
Natalia Goncharova at Tate Modern
Subscriure's a:
Missatges (Atom)