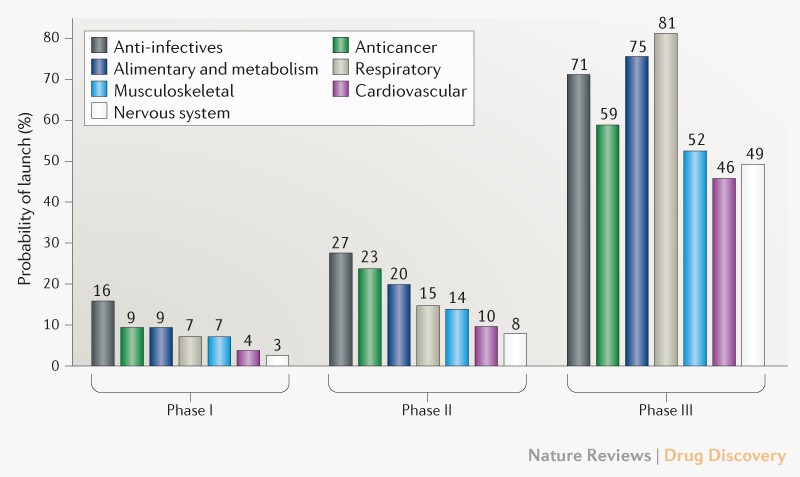
Clinical failure rates from phase I to drug launch remain at 93%.
If we look at nervous system it is the highest 97%, while the lowest failure is in anti-infectives 84%.

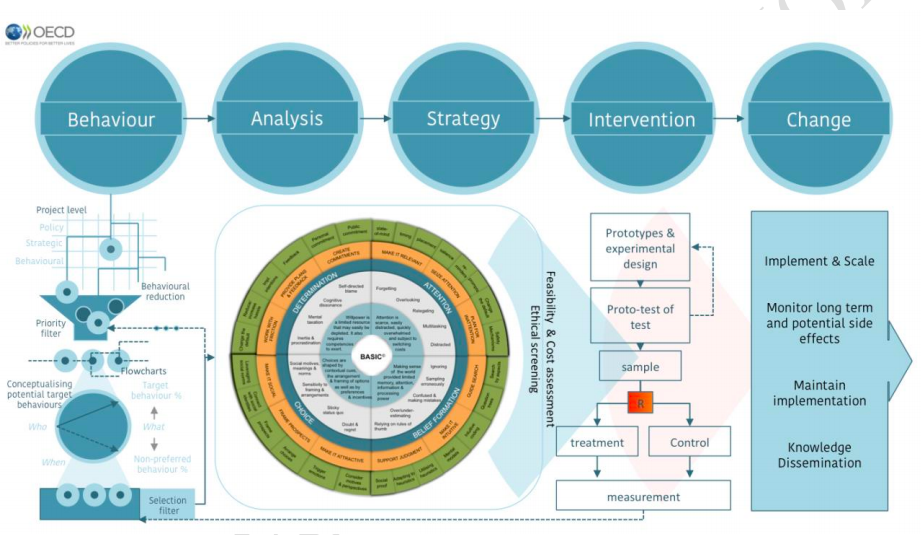
The approach developed by us is based on an outcome called years of sufficient capability (YSC). Instead of focusing on the absolute gains of capability across a population (i.e., capability maximization), the YSC targets those who fall below a threshold level of sufficient capability, with the aim being to improve capability to sufficient levels for those who are “capability poorThese are the five capabilities of most importance:
Stability— “ability to feel settled and secure”However, at the end, the same question without easy answer:
Attachment— “an ability to have love, friendship, and support”
Autonomy— “an ability to be independent”
Achievement— “an ability to achieve and progress in life”
Enjoyment— “an ability to experience enjoyment and pleasure”
How to define a sufficient threshold of capability needs to be considered further. One approach would be to conduct qualitative research using participatory methods to assign a sufficient threshold for a given population.Unfortunately the proposal of participatory methods and the measurement of capabilities is illusory, at least in my view.

| Product | Episode example | Sample conceptual focusa | Number of episodes | Clinical setting | Public episode definition | Linked risk-adjustment approach |
|---|---|---|---|---|---|---|
| 3M Patient-focused Episode Software | Not reported. | • Event-based episodes per patient • Cohort-based episodes among patients with a shared condition or characteristic | >500 | All | No | 3M Clinical Risk Groups |
| Cave Grouper | Urinary tract infection | • Physician relative efficiency and effectiveness scores • High-cost patient prediction | >500 | All | No | CCGroup MediScreen |
| CMS-BPCI | Urinary tract infection | Inpatient and post-acute care | ~50 | Inpatient, skilled nursing facility, inpatient rehabilitation facility, long-term care hospital or home health agency | Yes | No |
| McKinsey & Company | Perinatal | Principal Accountable Provider | >100 | All | Yes | Yesb |
| Optum Symmetry Episode Treatment Groups | Pregnancy, with delivery | • Patient total cost of care by condition categories • Provider profiling | >500 | All | Yes | Optum Symmetry Episode Risk Groups |
| OptumInsight Symmetry Procedure Episode Groups | Radical hysterectomy | • Medical and surgical procedure cost • Provider profiling | ~200 | All | No | Optum Symmetry Episode Risk Groups |
| Prometheus Analytics | Pregnancy | Potentially avoidable complications | ~100 | All | Yes | Prometheus Analytics risk adjustment |
| Medical Episode Grouper | Cardiac arrhythmias | • Population profiling • Provider profiling | >500 | All | No | Disease Staging and Diagnostic Cost Groups |
A weekly conversation that looks at the way technology is changing our economies, societies and daily lives. Hosted by John Thornhill, innovation editor at the Financial Times.
Prescription drug sales for 2010 through 2018 grew at a CAGR of +2.3%. This can be compared to the forecast annual CAGR of +6.9% for 2019 through 2024 with expected sales to reach $1.18trn. The growth rate for the prescription market in 2019 is forecast to be +2.0%, which depicts a decline in growth rate compared to 2018 (+5.0%). So far the industry has seen a major set-back with one of the biggest failures, aducanumab, which was discontinued in Phase 3 trials for Alzheimer’s disease.Distrust fortune tellers. Nobody knows anything about the future.
Pricing health services is a key component in purchasing the benefits package (the covered services) within the overall financing system (Evetovits, 2019). Pricing and payment methods are important instruments in purchasing that provide incentives for health care providers to deliver quality care. A second instrument is contracting, in which the conditions for the payment of services are defined, and prices can be used as signals to providers. A third is performance monitoring. Where health care providers are rewarded based on the outcomes they achieve, these payments also must be priced correctly to provide the right incentives.Right, there are more elements in the equation than prices, but the tools for fine tunning are too open. Anyway, this report is really welcome and the cases are well described.
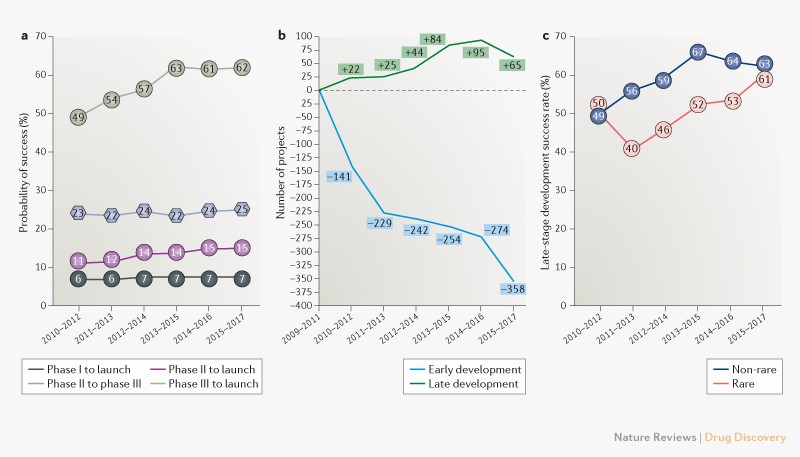
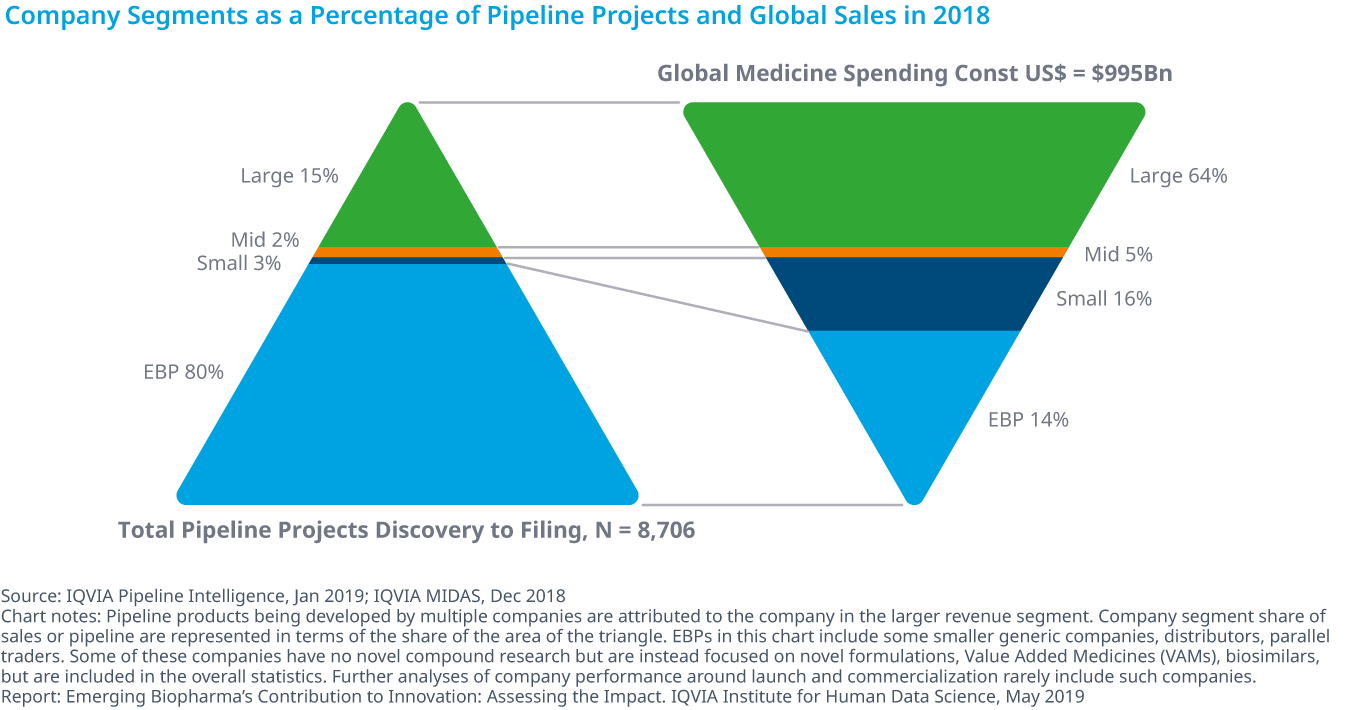
- Emerging biopharma companies accounted for 73% of the total late-stage R&D pipeline in 2018, compared with 61% in 2008.
- Large pharma companies have seen their share drop from 27% to 19% from 2017 to 2018.
- The share of mid-sized and small pharma companies developing novel products has remained steady since 2003, with small pharma developing approximately 5–6% of products and mid-sized pharma developing from 2–5%.
- Emerging biopharma companies are increasing their pipeline share, because they are the most active in the fastest-growing areas of oncology and orphan drugs, and because they increasingly can develop their innovations without the need to partner or be acquired.
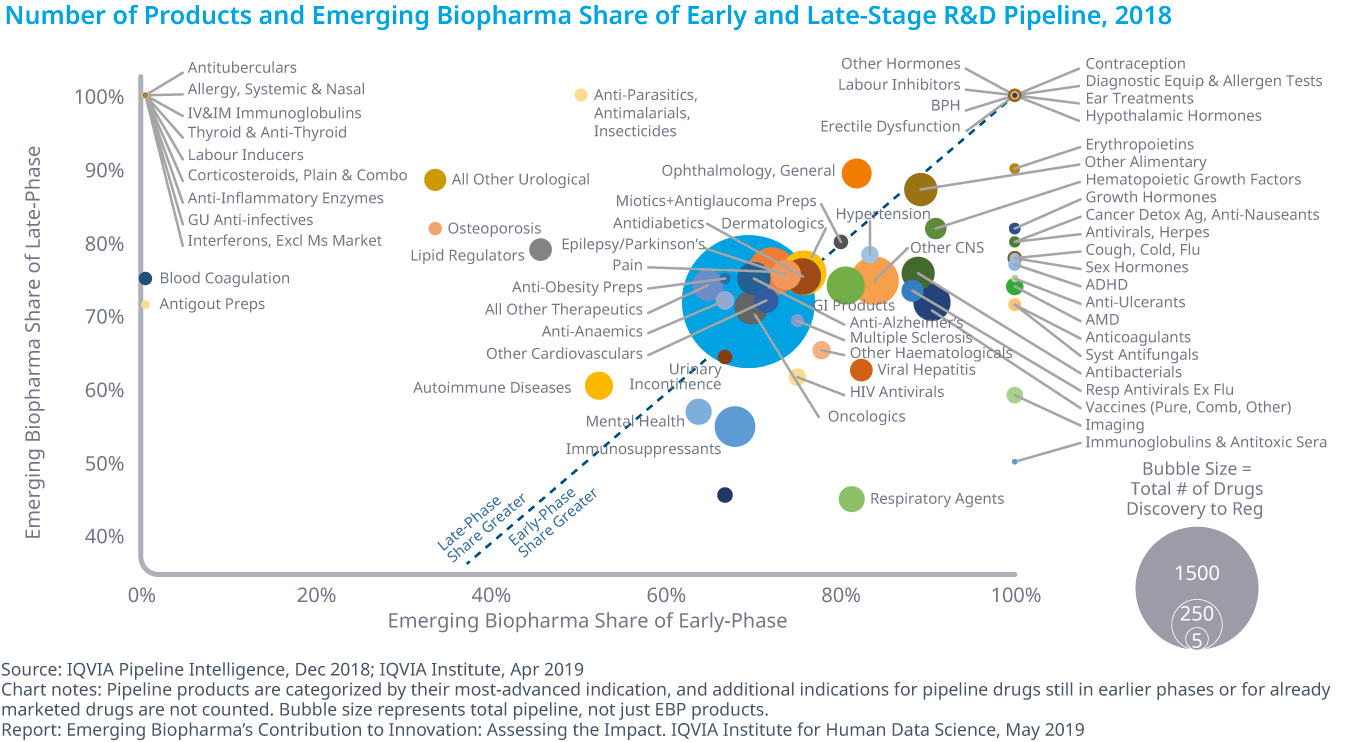
The 2018 launch of 15 new active substances (NASs) bring the total NAS launches since 2013 to 57 with 89 approved indications for 23 different tumor types Within the R&D oncologic pipeline, the most intense activity is for immunotherapies, with almost 450 in clinical development A total of 1,170 oncology clinical trials were initiated in 2018, an increase of 27 percent from 2017 and 68 percent from 2013 More than 700 companies across the globe have oncology drugs in late-stage development, including 626 emerging biopharma companies and 28 out of the 33 largest pharma companiesOn costs in USA:
The average annual cost of new medicines continues to trend upward, although the median cost dropped $13,000 in 2018 to $149,000, and cost per product ranged betweenOn value?
$90,000 and over $300,000. The mean cost for new brands in 2018 was $175,578, down from $209,406 in 2017, but was above the $143,574 mean from 2012 to 2018.
Spending on cancer medicines is heavily concentrated, with the top 38 drugs accounting for 80% of total spending. Over half of cancer drugs earn more than $143.6 million in annual sales and in aggregate account for only 2.2% of oncology spending.
We find that the overall success rate for all drug development programs did decrease between 2005 (11.2%) and 2013 (5.2%), as anecdotal reports suggest. However, this decline reversed after 2013. The overall success rate is mainly driven by changes in POS1,2 and POS2,3. The timing of the upward trend coincides with the time period during which the FDA has been approving more novel drugs,compared to the historical mean.Quite surprising. The accelerated approval by FDA ends with more drugs withdrawn from the market. Therefore, the probability of success is a flawed statistic. It should be adjusted according to regulator criteria.


