23 de febrer 2018

Resource allocation principles and process

Public Preferences About Fairness and the Ethics of Allocating Scarce Medical Interventions

Fair allocation of health care resources is a challenge that we can't solve strictly with some criteria or principles. Of course, we do need some benchmark but we require a fair and transparent process. This is precisely the focus of a chapter by Govind Persad in a recent book. The key issue is how in fact resources should be allocated.
Society is ultimately interested not only in empirical surveys of how its members believe medical interventions should be allocated, but also in answers to the normative question of how medical resources should be allocated.
Survey methods, experts opinion,...
Even though public attitudes do not directly determine the solution to moral problems, empirical research into public attitudes can be useful in a variety of  ways. By showing which beliefs are popular among the public, or which beliefs are points of division, empirical research can help to focus moral inquiry on those claims or beliefs, thereby ensuring that philosophical reasoning is relevant to real-world problems. Furthermore, even though popularity does not constitute correctness, the unpopularity of a normative position can justify placing it under scrutiny.



21 de febrer 2018

Pharma R&D failure and success

Clinical Development Success Rates 2006-2015

In the russian rulette as a lethal game of chance you may have 1/6 chance of being shot. If the chamber of the revolver holds 6, a 16,6%.
In drug industry the probability of R&D failure is 90.4%. We all know that in the drug cost we are paying also for failures, but we forget the figure.

These are the key takeaways of the report:
  • The overall likelihood of approval (LOA) from Phase I for all developmental candidates was 9.6%, and 11.9% for all indications outside of Oncology.
  • Rare disease programs and programs that utilized selection biomarkers had higher success rates at each phase of development vs. the overall dataset.
  • Chronic diseases with high populations had lower LOA from Phase I vs. the overall dataset.
  • Of the 14 major disease areas, Hematology had the highest LOA from Phase I (26.1%) and Oncology had the lowest (5.1%).Sub-indication analysis within Oncology revealed hematological cancers had 2x higher LOA from Phase I than solid tumors.
  • Oncology drugs had a 2x higher rate of first cycle approval than Psychiatric drugs, which had the lowest percent of first-cycle review approvals. Oncology drugs were also approved the fastest of all 14 disease areas.
  • Phase II clinical programs continue to experience the lowest success rate of the four development phases, with only 30.7% of developmental candidates advancing to Phase III.
PS. The growth in R&D expenses was 14% in 2016, while revenues grew 4% (p.36).

19 de febrer 2018

Public funding of succesful Pharma R&D

Contribution of NIH funding to new drug approvals 2010–2016

If we consider the 210 new molecular entities (NMEs) approved by the Food and Drug Administration from 2010–2016, then you'll find that NIH funding contributed to published research associated with every one. A PNAS article explains that:
Collectively, this research involved 200,000 years of grant funding totaling more than $100 billion. The analysis shows that 90% of this funding represents basic research related to the biological targets for drug action rather than the drugs themselves. The role of NIH funding thus complements industry research and development, which focuses predominantly on applied research. This work underscores the breath and significance
of public investment in the development of new therapeutics and the risk that reduced research funding would slow the pipeline for treating morbid disease.
This public funding is forgotten in the costs of a new molecule. Although in the price, the manufacturer surplus doesn't remunerate such contribution. Some adjustment should be applied, to be fair.

18 de febrer 2018

Digital medicine, or just medicine

Digital medicine, on its way to being just plain medicine

You may remember at the begining of this century. Everybody was talking about e-business and right now nobody talks about it, because it is just business.The same will happen with digital medicine, it ill be just medicine in the next future. A future that is closer than you may think. And this is what E. topol explains in the editorial of the new open journal, and says_
And finally, quite paradoxically, we hope that npj Digital Medicine is so successful that in the coming years there will no longer be a need for this journal, or any journal specifically focused on digital medicine.
I agree. But meanwhile, somebody should review current syllabus and studies of medicine, to introduce a change in the profession and the scope of practice.


16 de febrer 2018

Spending a lot for many years: understanding persistence

Long-Term Health Spending Persistence among the Privately Insured in the US

If you don't want to read this article, check this presentation. It is one of the best efforts to understand persistence of health expenditures. Summarised findings:
First, persistence by demographic characteristics is generally lower than persistence by co-morbidities. Because co-morbidities are harder to assess, particularly for new enrollees, than demographics, this highlights the need for robust risk prediction models. 
Second, people with a co-morbid condition relative to those without the condition are considerably more likely to be in the top 10 per cent of spenders in year t regardless of whether they were in the top 10 per cent in year t–1. However, people with a co-morbid condition are even more likely to be in the top 10 per cent in year t if they were also in the top 10 per cent in year t–1.
Third, those most likely to be in and remain in the top 10 per cent are those with myocardial infarction, congestive heart failure and peptic ulcer disease and in several psychiatric diagnostic groupings, which indicates that these conditions might be appropriate targets for longer-term disease management programmes.
Fourth, although most conditions are less common at younger ages, when they do occur they are more predictive ofpersistently high spending at younger ages, as almost all conditions have the highest predicted probabilities on being in the top 10 per cent of spenders in the following year when they occur at ages under 25 and the lowest predicted probabilities when they occur in the 65-and-over population. Essentially, the presence of a condition at a younger age more clearly differentiates a person’s health care trajectory from that of their peers.
These are conclusions for US population, closer studies are needed.
PS. An article written 23 years ago, on concentration and an abstract 11 years ago.

13 de febrer 2018

How morbidity explains health expenditures in ageing

Ageing and healthcare expenditures: Exploring the role of individual health status

Everybody admits that ageing increases health expenditures. However the dynamics of this growth, and the factors that contribute it, are less known. In our recent article, we explain why morbidity is the main factor that explains growth of health expenditures in ageing. In our analysis, closeness to death is not the main cause.
Regardless of the specific group of healthcare services, HCE at the end of life depends mainly on the individual health status. Proximity to death, sex, and marginally age approximate individual morbidity when it is excluded from the model. The inclusion of morbidity generally improves the goodness of fit. These results provide implications for the analysis of ageing population and its impact on HCE that should be taken into account.
We do need further research on the cost and intensity of care in the last months of life, and this is our next challenge.


07 de febrer 2018

Diversity and differences in nature and society

Inequality in nature and society

If the title of an article is about "inequality", our brain starts thinking inmediately about equality, with some moral background. It's unavoidable. If the title is "diversity and differences", than we admit it as statement. I would suggest to have a look at this interesting article in PNAS that compares what happens in society and in nature, please forget any previous influence of values.
As a first illustration of the similarities of patterns in nature and society, consider the wealth distribution of the world’s richest individuals compared with the abundance distribution of the Amazon’s most common trees (Fig. 1 A and B). The patterns are almost indistinguishable from one another. For a more systematic comparison, we also analyzed the Gini indices of a wide range of natural communities and societies (Fig. 1 C and D). The Gini index is an indicator of inequality that ranges from 0 for entirely equal distributions to 1 for the most unequal situation. It is a more integrative indicator of inequality than the fraction that represents 50%, but the two are closely related in practice (SI Appendix, section 3). Surprisingly, Gini indices for our natural communities
are quite similar to the Gini indices for wealth distributions of 181 countries (data sources listed in SI Appendix, section 1).
This is only a statement that you can confirm.
 Our analysis suggests that even if all actors are equivalent, in the absence of counteracting forces, there is an intrinsic tendency for significant inequality to arise from multiplicative chance effects. Although the surprising similarity between inequality of species abundances and wealth may have the same roots on an abstract level, this does not imply that wealth inequality is “natural.” Indeed, in nature, the amount of resources held by individuals (e.g., territory size) is typically quite equal within a species.
Now the metaphor has been clarified. Differences in wealth does not imply that are "natural". Fortunately our country is less different now than before. We have moved from a Gini of 33 in 2013 to 31.4 in 2016, quite good. You'll not find this reflected in any newspaper -it seems that this statement does not sells issues-, though these are the official figures.


05 de febrer 2018

Estimating health expenditures

Modeling Health Care Expenditures and Use

The skewed distribuition of health expenditures with a large number of 0 observations poses difficulties. A recent article in Annual Review of Public Health explains the details and the right approach, in my opinion.
We compare estimation and interpretation of the effect of a change in insurance policy on health care expenditures using OLS and a two-part model. The two-part model is based on a statistical decomposition of the density of the outcome into a process that generates zeros and a process that generates positive values. A logit or probit model typically estimates the parameters that determine the threshold between zero and nonzero values of the outcome. In general, alternative specifications of the binary choice model (the first part) yield nearly identical results. However, the choice of model for the distribution of the outcome conditional on it being positive (the second part) is critically important. Different models can yield quite different results.We use a generalized
linear model to estimate the parameters that determine positive values. Generalized linear models accommodate skewness in natural ways, give the researcher considerable modeling flexibility, and fit health care expenditures extremely well.
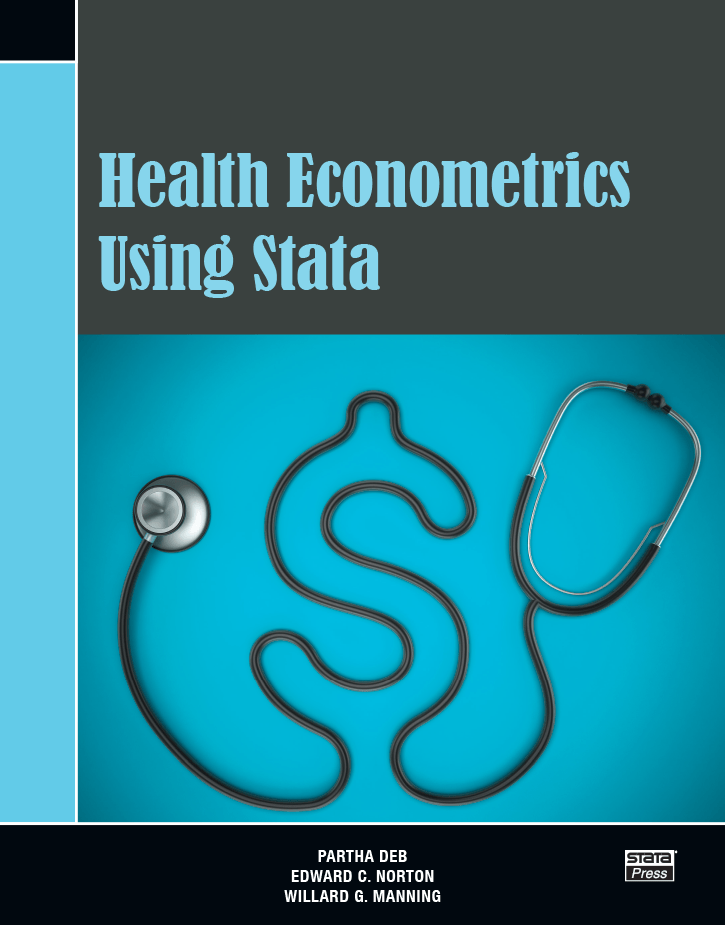
The use of two parts models, and GLM is the standard approach to take into account. The book Health econometrics using Stata is the key reference.


26 de gener 2018

On experts and priorities

Priorización de intervenciones sanitarias. Revisión de criterios, enfoques y rol de las agencias de evaluación

Often I hear that prioritisation of benefits could be solved by evaluation agencies and the appropriate application of cost-effectiveness analysis. As times goes by, I'm convinced that this is a way to avoid if we consider how priorities should be set. In other words, leaving this issue to a technical perspective is not enough. There is a need for a deliberative way to tackle the complexities of prioritisation.
Anyway, if you want to know a review that takes as given the experts view, check this article. If you want to understand the whole issue from a broader perspective, then read the book I quoted in this post some months ago.

 Carlos Diaz at Sala Parés

24 de gener 2018

Challenges in Cost-Effectiveness Analysis of genomic tests


Type of challengeExample of challengeDescription of challenge
MethodologicalSelecting the appropriate evaluative frameworkIs the standard extra-welfarist view and use of CEA appropriate, or should the distinct theoretical approach reflecting the welfarist view and use of CBA be adopted to allow consequences other than health gain, such as the value of diagnostic information from the genomic-targeted diagnostic test, to be valued?
Relevant study perspectiveIs the standard recommendation to focus on the use of health-care services appropriate when the genomic-targeted diagnostic test may provide information that affects the use of other services, such as education or employment?
Relevant time horizonIs a lifetime sufficient when the impact of a genomic-targeted diagnostic test may extend to infinite time horizons that are not limited by the lifespan of one individual?
Defining the relevant study populationIs the standard definition of a patient (the person receiving the technology) appropriate when there could be spillover effects to family members (currently alive or to be born) as a result of information from a genomic-targeted diagnostic test?
Valuing consequencesIs identifying and measuring the impact on health status alone sufficient to capture the (good and bad) consequences of a genomic-targeted diagnostic test?
TechnicalVariation in the individual characteristics of the relevant study populationThe use of cohort state transition Markov models, sometimes combined with decision trees, cannot easily capture the impact of individual patient variation within a population with different genotypes and phenotypes
Number of diagnostic and, if appropriate, subsequent treatment pathwaysThe use of cohort state transition Markov models, sometimes combined with decision trees, cannot easily account for multiple comparators often needed when evaluating a new genomic-targeted diagnostic test
Capturing impact of reduced time to diagnosisThe use of cohort state transition Markov models, sometimes combined with decision trees, cannot account for the impact of reduced time to achieve a diagnosis, which is often a proposed benefit of a genomic-targeted diagnostic test
Capturing impact of capacity constraintsDecision analytic model-based CEA currently assumes limitless capacity within health-care systems, which is often not a reasonable assumption when introducing a genomic-targeted diagnostic test to populations for whom a diagnosis was not previously available
PracticalAvailability of dataThere is often a lack of data available to populate decision analytic model-based CEA
National tariff of test costNo national tariff for genomic-targeted tests exist
OrganizationalComplex health-care systemsDecision analytic model-based CEA assumes that money saved and benefits accrued are transferable, but this is often challenging in complex health-care systems that comprise an overarching funding mechanism (public, private, insurance), a service and staffing model for providing care for different sectors (community, general practice, hospital, specialist) and a means of allocating funding to these different sectors
Generalizability of resultsDecision analytic model-based CEA is relevant only to the defined decision problem, and decision-makers who want to use the results must decide whether the focus of the analysis is relevant to their own jurisdiction
Expensive nature of health technology assessmentDecision analytic model-based CEA conducted within national health technology assessment processes requires considerable funding and expertise that are not available to all, which may contribute to the inequity in access to new genomic-targeted diagnostic tests across the world
  1. CBA, cost-benefits analysis; CEA, cost-effectiveness analysis.